November 3, 2020 - To build an understanding of the current market trends that are impacting the Memphis Metro area, the Chamber has been releasing monthly updates to our economic recovery.
To best gauge and position insights related to market activity, we are looking at the region through two lenses. The first is through the lens of traditional monthly indicators. These measures include the lower frequency jobs and unemployment figures and are often seen as lagging indicators of labor market activity. The second lens is through higher frequency weekly indicators. These measures include weekly unemployment insurance claims and job postings. Often, the higher frequency indicators are seen as leading indicators and can signal worsening or better employment outcomes for the region against the monthly reports.
With the release of the September 2020 unemployment numbers on October 28, these updates will provide a key snapshot of where the Memphis market sits as it relates to a recovery from the March/April 2020 contraction.
The Greater Memphis Chamber develops insights that help stakeholders ask the right questions to issues impacting our region’s economic competitiveness. To understand the impact of COVID in the current economic environment, the team analyzes data using a combination of sources such as the Bureau of Labor and Statistics as well as cutting-edge tools such as Burning Glass Labor Insights and EMSI, the Chamber aims to provide stakeholders with information that can help drive prosperity for all in the region.
Indicators to Watch

Key insights from this report:
Monthly Indicators, [lower frequency, lagging indicators]
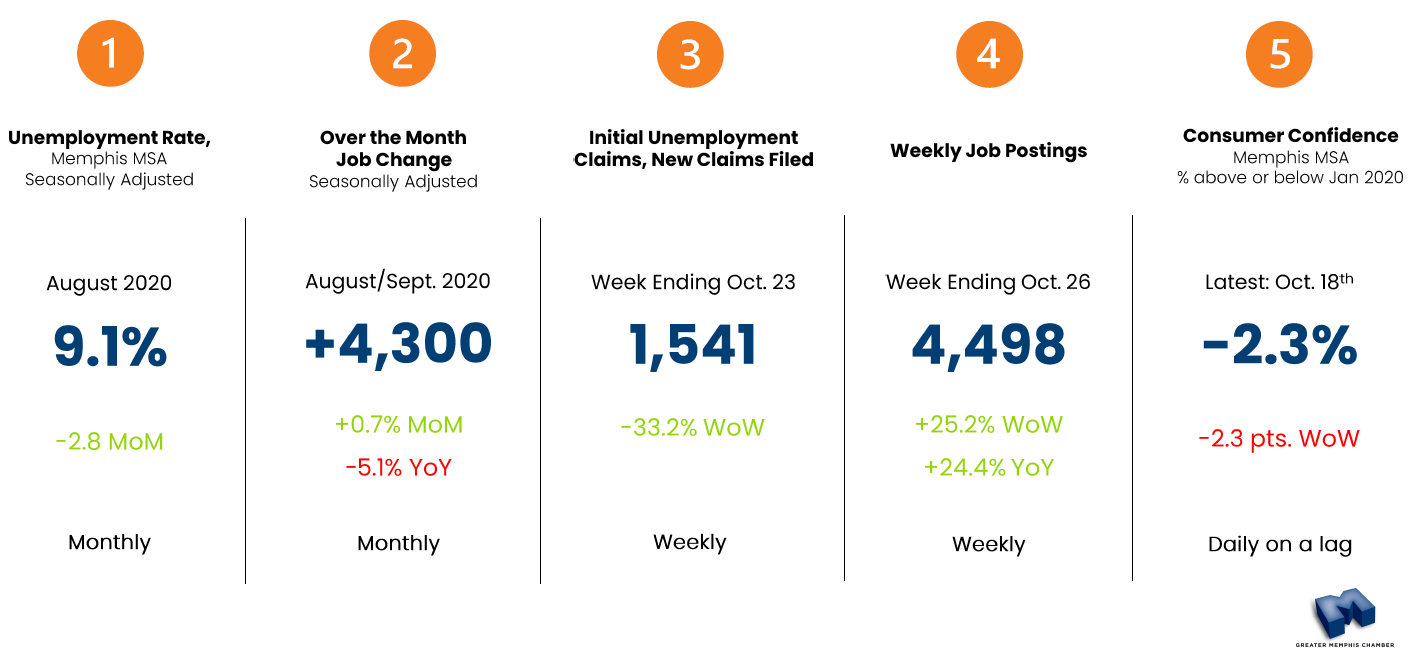
- September 2020, the unemployment rate in the Greater Memphis MSA fell 2.8 seasonally adjusted points to 9.1%. As the largest month-over-month decrease since recovery commenced, the Greater Memphis MSA closed the gap between the State of Tennessee and the Nation, whose September 2020 unemployment rates fell to 6.3% and 7.9%, respectively. The next release for (October 2020) metropolitan employment estimates will be December 03, 2020.
- While the decrease in the region’s unemployment rate is positive, the Civilian Labor Force contracted by 12,378 August to September, meaning individuals exited the labor force. We must be careful to recognize that the drop in the region’s unemployment rate is partially driven by the decline in the labor force, rather than all increasing employment. Simply stated, if you have less people in the labor force and more people employed, it influences the unemployment numbers in a manner that understate the true extent of what’s happening in the labor force.
- Non-farm payrolls (jobs) in the Memphis metropolitan area increased by a seasonally adjusted 4,300 in September 2020, a month-over-month increase of 0.7%.
Weekly Indicators, [higher frequency, leading indicators]
- Continued claims have fallen considerably (61.3%) since the last week ending July 25, 2020. Initial and continued unemployment insurance claims have decreased significantly. This has been reflected within the September 2020 unemployment numbers. While its feasible to suggest that some of these individuals have dropped out of the labor force, downward adjustments should continue to be illustrated in the lower frequency, monthly unemployment numbers.
- Online job postings, a proxy for employer demand have stabilized against historical levels. This is reassuring, as employers rebound and stabilize against new workplace dynamics. While indicative of demand, jobseekers should leverage skills for in-demand occupations within new industries. Week ending October 24, 2020 was 24% higher than this same week in 2019.
- While the Greater Memphis market holds relatively high unemployment, many employers continue to hire. Broad based occupational groups are in demand in key areas including: Logistics and Supply Chain Support, Office Support and Customer Care, Healthcare, and Accommodation and Food Services.
Questions? We would love to hear from you! Click here to send a question or request media access.


